
Crude oil rallied close to 10 percent this week on renewed Middle East tension. It spread to the rest of the board as a headwind, a direct input-cost shock for packaged food and beverage, and more pressure on bond yields that were already climbing. The sector-average support score, equal-weight across the eleven sectors tracked here, closed Friday at 44.3, its lowest Friday close in two months and a fourth straight week of lower closes. The conviction that pushed crude to a two-month high did not translate into broad conviction anywhere else, and in at least one sector's case, it was a crushing weight.
The shape of the week, and a rally I can only half explain
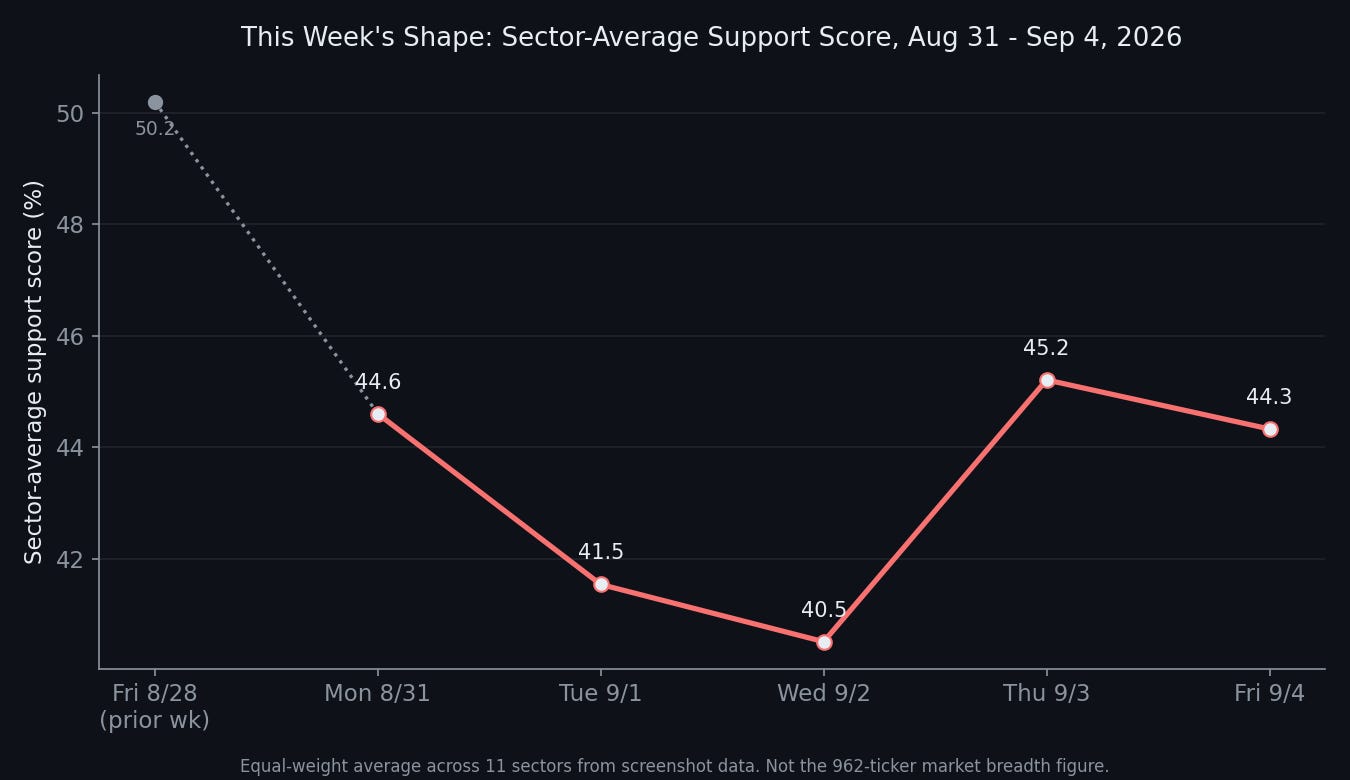
The board opened the week already lower, 44.6 Monday against last week’s 50.2 close, then fell further to a two-month low of 40.5 by Wednesday before a modest recovery into Friday’s 44.3.
Real Estate did a real share of that damage on its own. Friday’s detailed breakdown puts its median at roughly 5 percent. That means more than half the names in the sector are sitting below nearly all of their top historical high-volume institutional price levels, not a soft patch, a genuine capitulation. The sector actually bottomed intraweek at 9.1 on Tuesday, the lowest single-day reading I have recorded for any sector in the past two months. Friday’s close of 18.6 looks like a small recovery only because the bar had fallen so far.
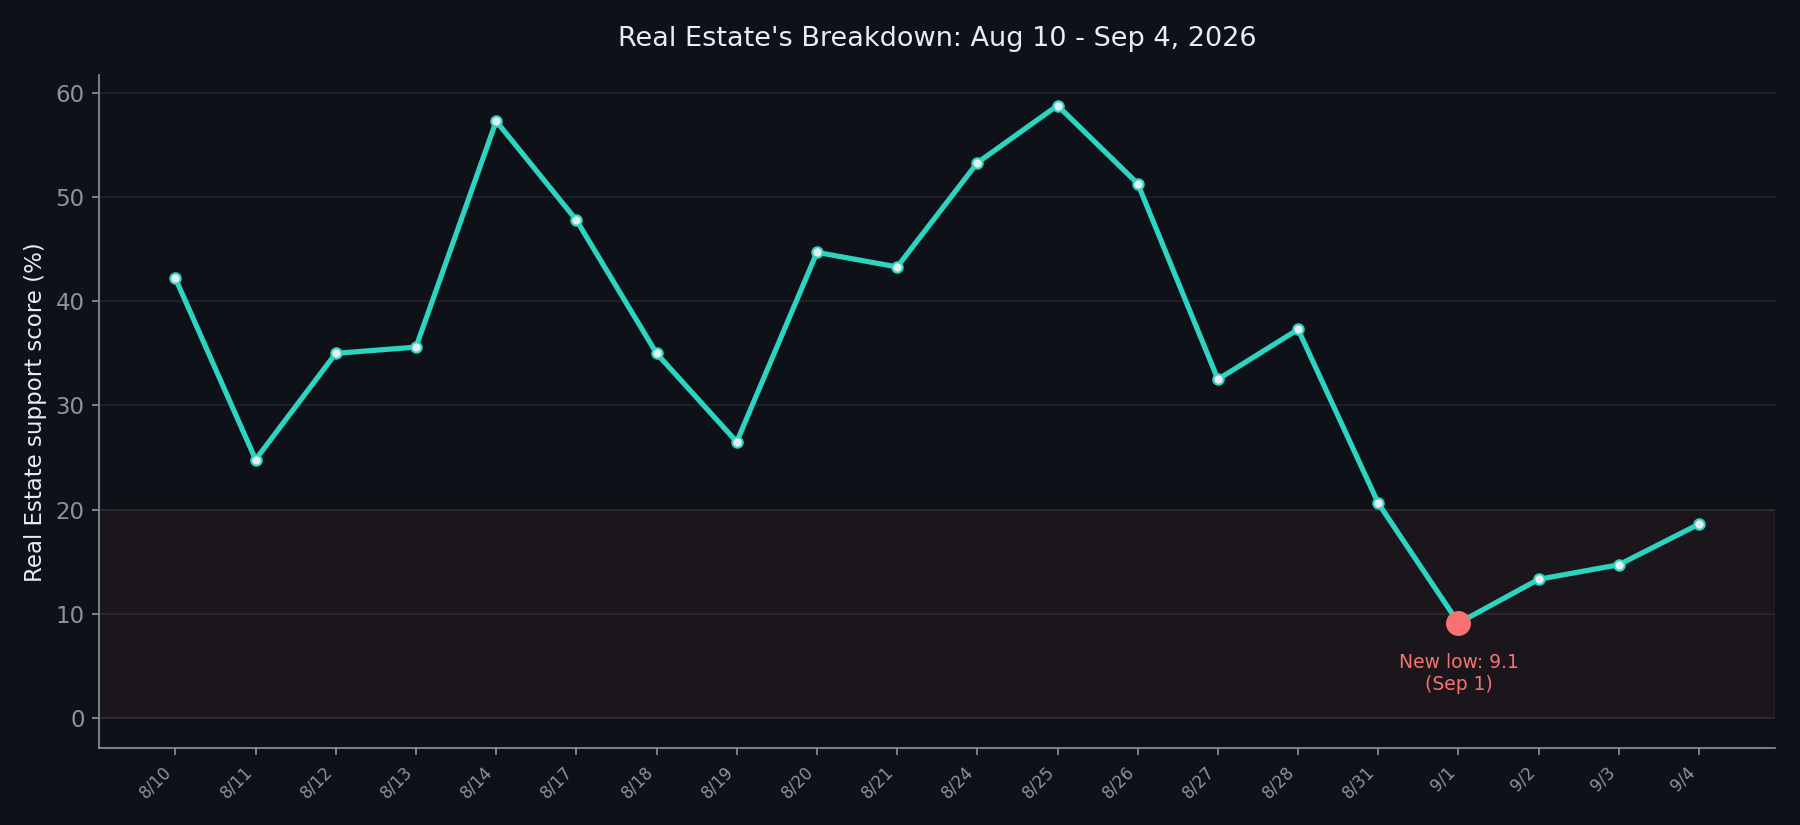
Real Estate’s mean sits well above that median, around 19, which means even the sector’s already-bad headline number is being flattered by a handful of stronger names. The typical Real Estate ticker right now is closer to broken than the average score would ever tell you. This is the clearest, least ambiguous single-sector signal I have this week, and on its own it explains a meaningful chunk of why the board-wide average sits at a two-month low.
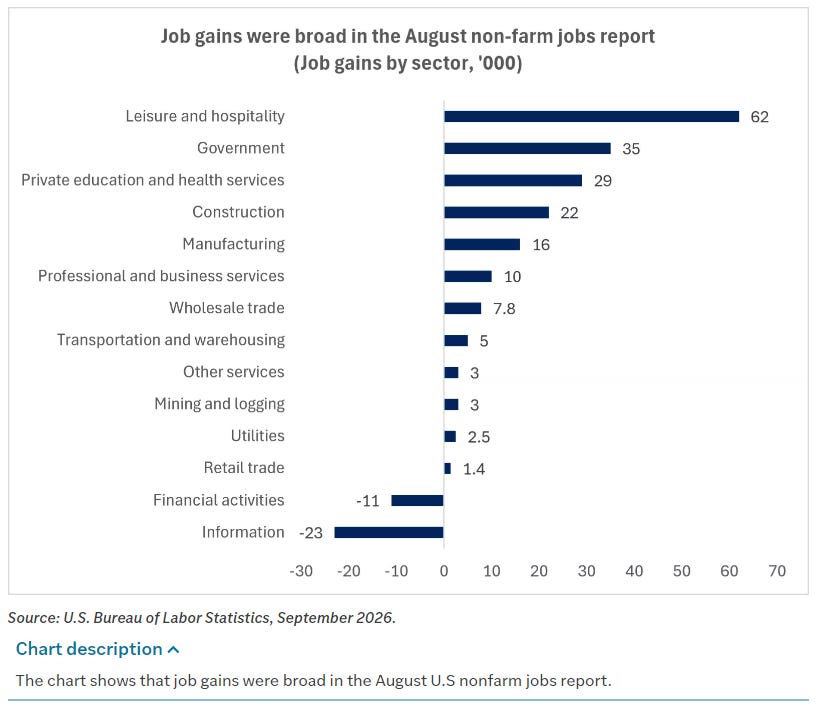
August payrolls came in at 162,000, nearly triple the 53,000 economists expected and the strongest month of job growth since March. July’s initial scare of a 23,000 job loss was revised up to a 21,000 gain. Unemployment held steady at 4.1 percent. Gains were broad-based, food services, government education, construction, and manufacturing all contributing. This was a strong report, and by most accounts it caught markets off guard, reviving fears that the Fed would need to keep rates higher for longer rather than easing any time soon.
That is a harder macro read to square with the sector data than it might first appear. A strong jobs report extends last week’s hawkish theme rather than reversing it, less urgency for a cut, not more. Yet Financial Services rose 13.8 points this week, the best mover on the board, and Utilities rose 12.7, the second best, the same two rate-sensitive sectors that sat near the bottom last week under the same hawkish pressure. Financial Services rallying on strong labor data has a reasonably clean explanation even without any help from rate-cut hopes, banks benefit directly from a resilient economy, lower credit risk, healthier loan growth, a steeper curve, regardless of when or whether the Fed eases. Utilities rallying the same week is the harder one to explain. Utilities are a bond-proxy sector that typically wants lower rates, not a stronger case for higher-for-longer, and I do not have a clean mechanism for why it was the week’s second-best mover under a macro backdrop that argues against it. It’s plausible that the AI/data-center power-demand story that’s been re-rating utilities as a growth trade rather than a defensive one for a while now may just be coincidentally timed with the oil spike, and the same underlying bid could have shown up on a quiet news week too. Just a hypothesis, not something the sector board can settle.
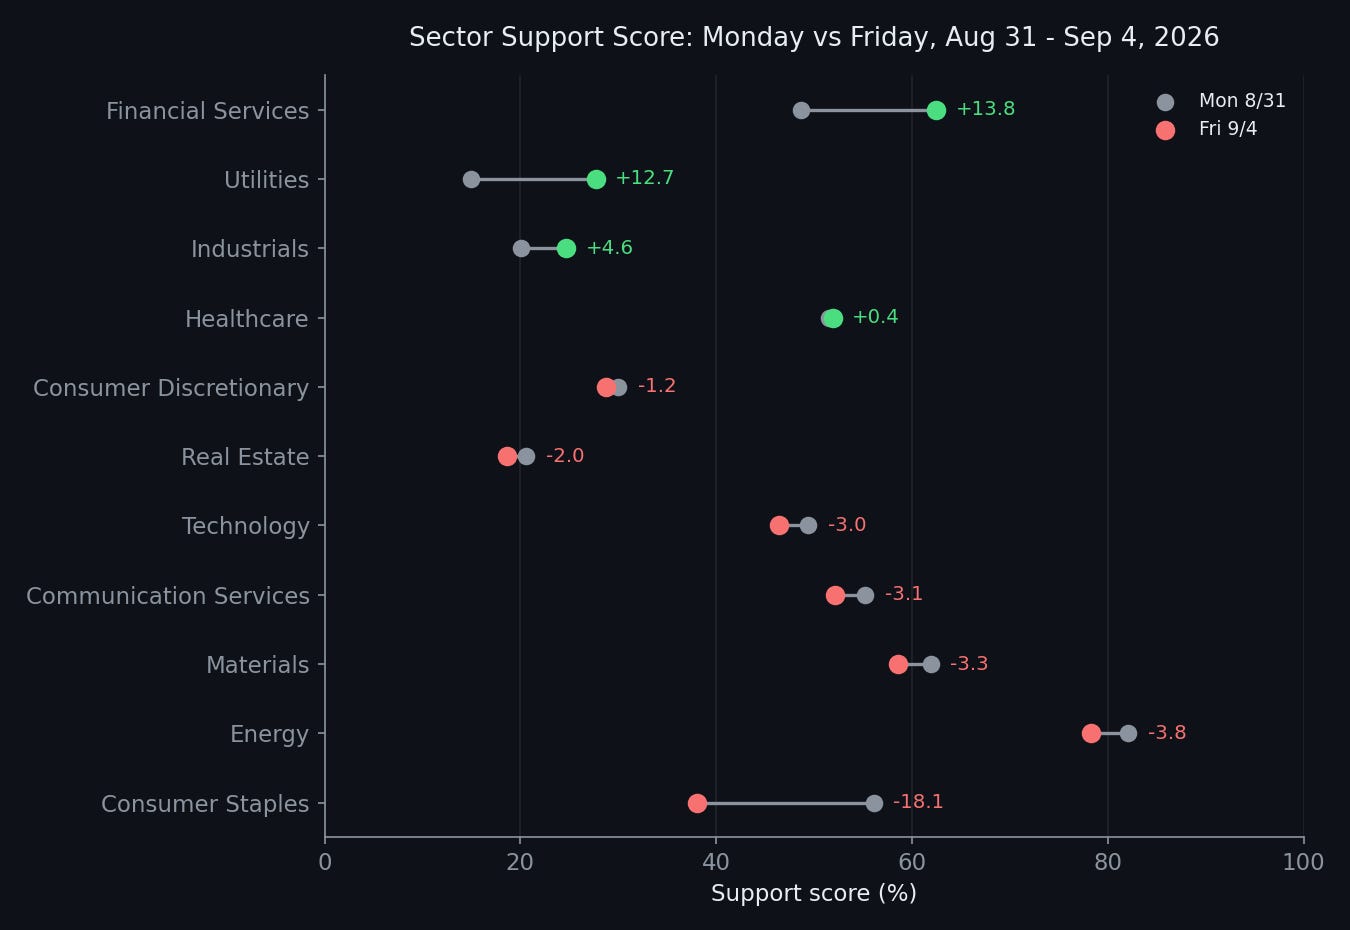
Consumer Staples was this week’s actual worst mover, down 18.1 points, the single biggest Monday-to-Friday drop on the board, and it splits into two separate stories rather than one, which is why the size of the move looks too big if you reach for either story alone. The idiosyncratic piece: Campbell’s cut its dividend by roughly 36 percent midweek, guided soft, and flagged weakness in salty snacks along with impairments, and General Mills and Kraft Heinz both sold off on the read-across.
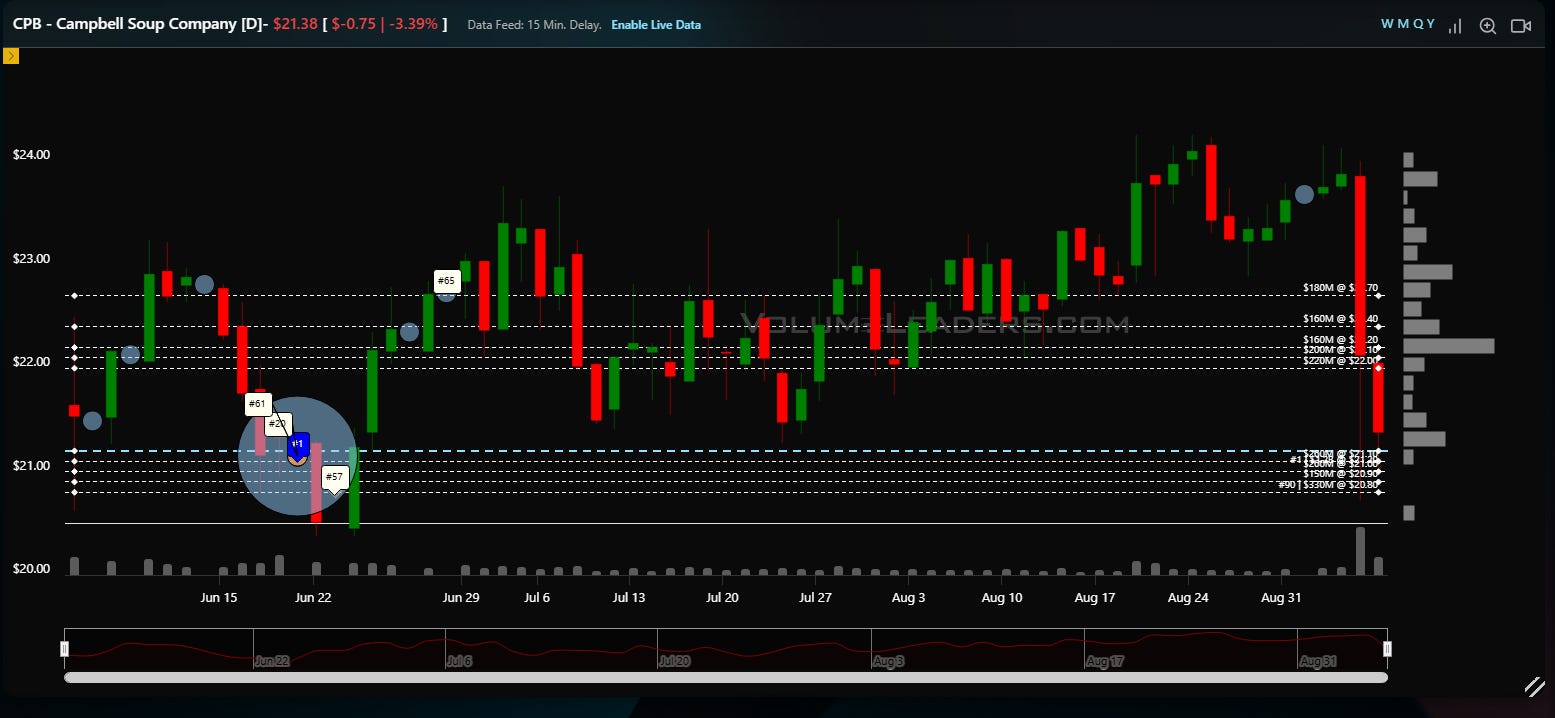
The rout in CPB landed back at its #1 largest level and #1 largest trade ever…stunning coincidence, right? A multi-name flush through the center of the packaged-food complex will crush a support-score print on its own, independent of anything else happening that week. The macro piece: this was also close to the worst possible regime for this sector to sit in, oil up 9 to 10 percent is a direct input-cost shock for packaged food and beverage, freight, packaging, oils, all more expensive, long yields grinding higher make dividend-paying bond-proxy names less attractive at the same time hike odds are waking back up, and a strong labor print reduces the case for owning defensives generally, fewer people want to own soup stocks the week the economy just printed 162,000 jobs. Staples was not a pure rates story and it was not a pure single-stock story, it was both landing in the same five days, and that’s a powerful combination.
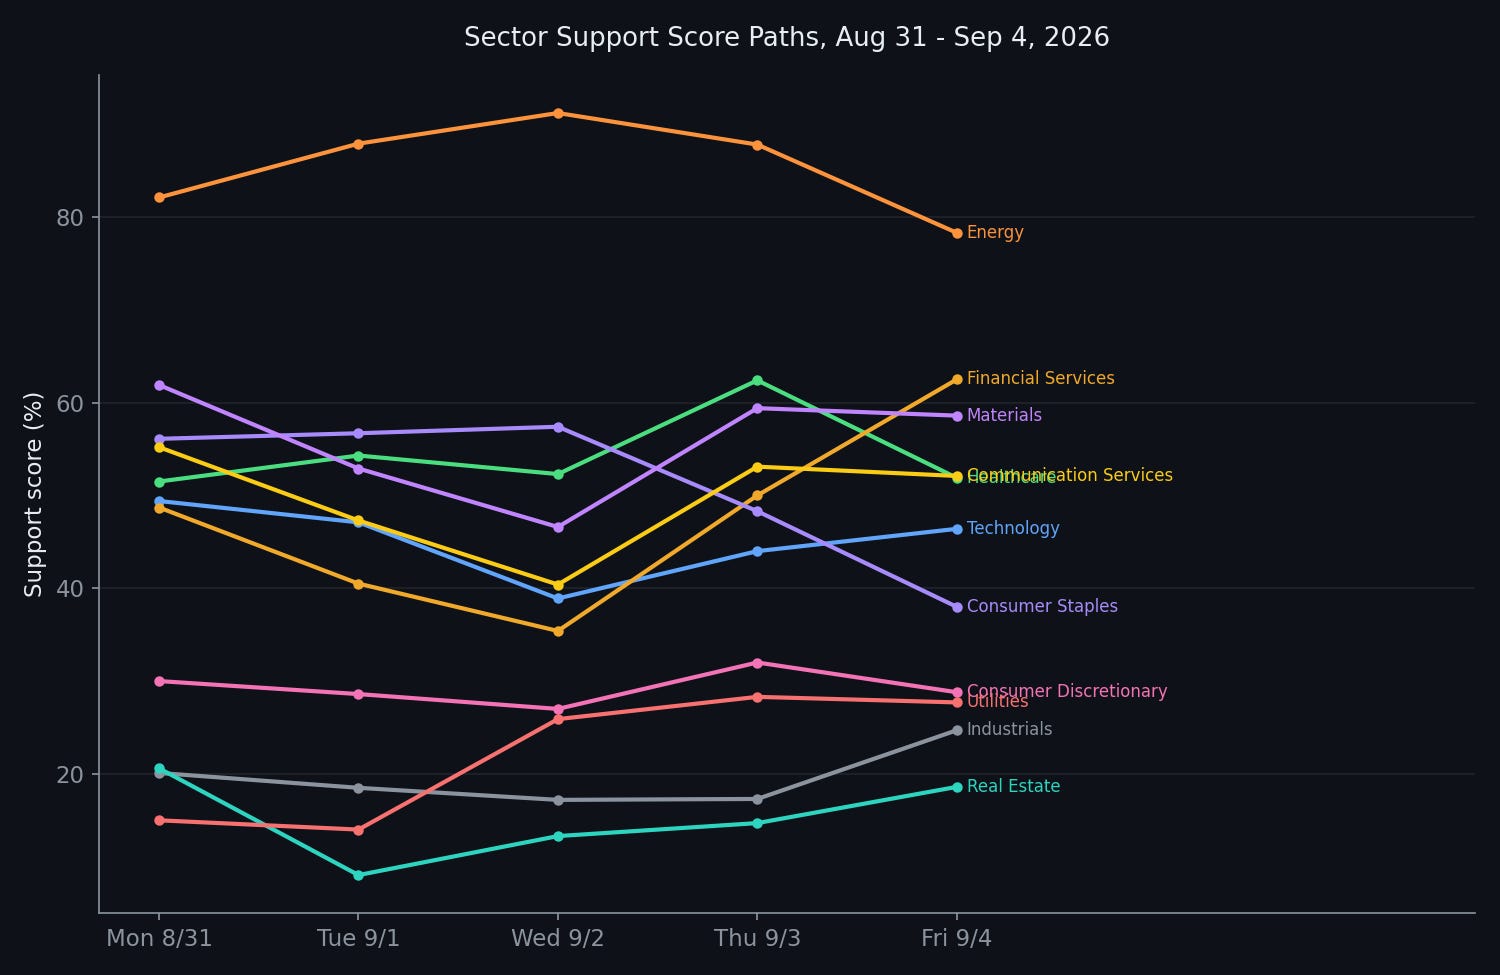
Real Estate’s own Monday-to-Friday move this week was a modest -2.0, nothing close to Consumer Staples’ drop. What makes Real Estate the standout is not this week’s delta, it is the multi-week collapse into Tuesday’s low and the median sitting near zero on Friday. Two different sectors, two different kinds of bad week, worth not blurring together. Energy gave back a modest 3.8 points on the week despite closing near its own recent highs, more on that below. Technology, Materials, and Communication Services all drifted lower by similar, moderate amounts, all second-fiddle to the week’s real story.
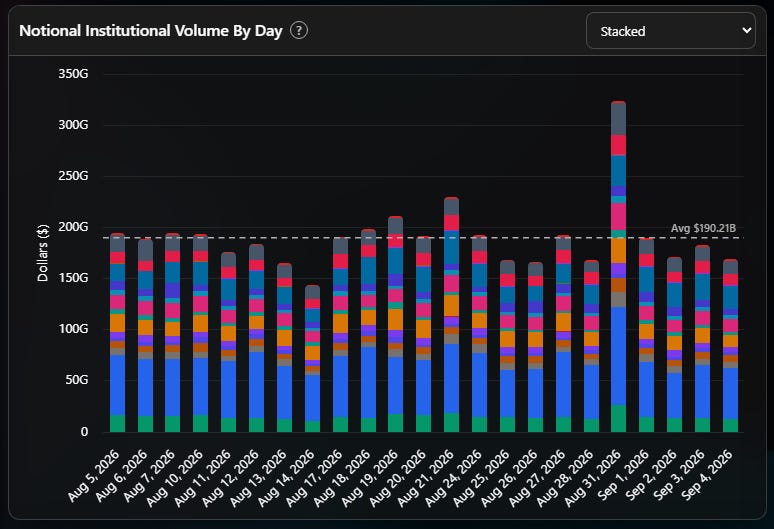
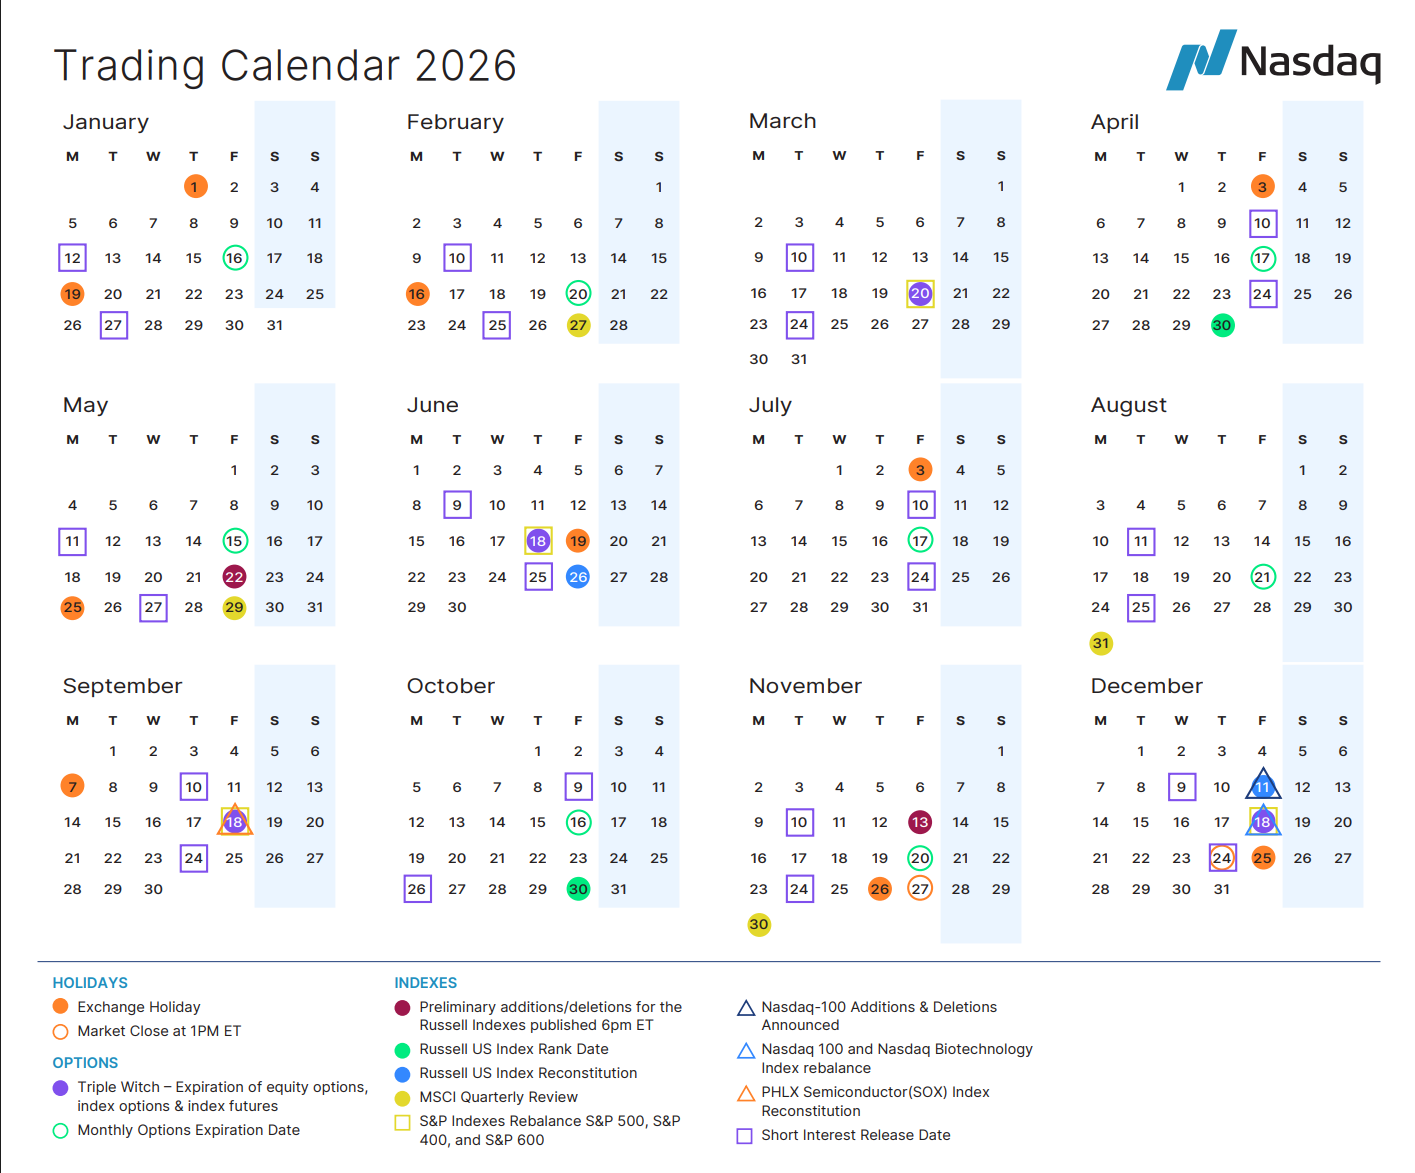
Monday’s institutional volume is worth a mention on its own. It came in well above $300 billion, the largest single day I have for about a month, comfortably clear of the roughly $190 billion running average. MSCI rebalance plus end-of-month flows pushed aggregate notional to new local highs.
Where price and positioning disagree
Zoom out past this single week and a bigger pattern shows up. Here is sector-average support score against SPY going back to July 6, and for the first six weeks or so the two move loosely together, both bottoming around July 24, both climbing into mid-August, both peaking within a day of each other around August 14 and 18. The last three weeks is specifically where the relationship visibly breaks down.
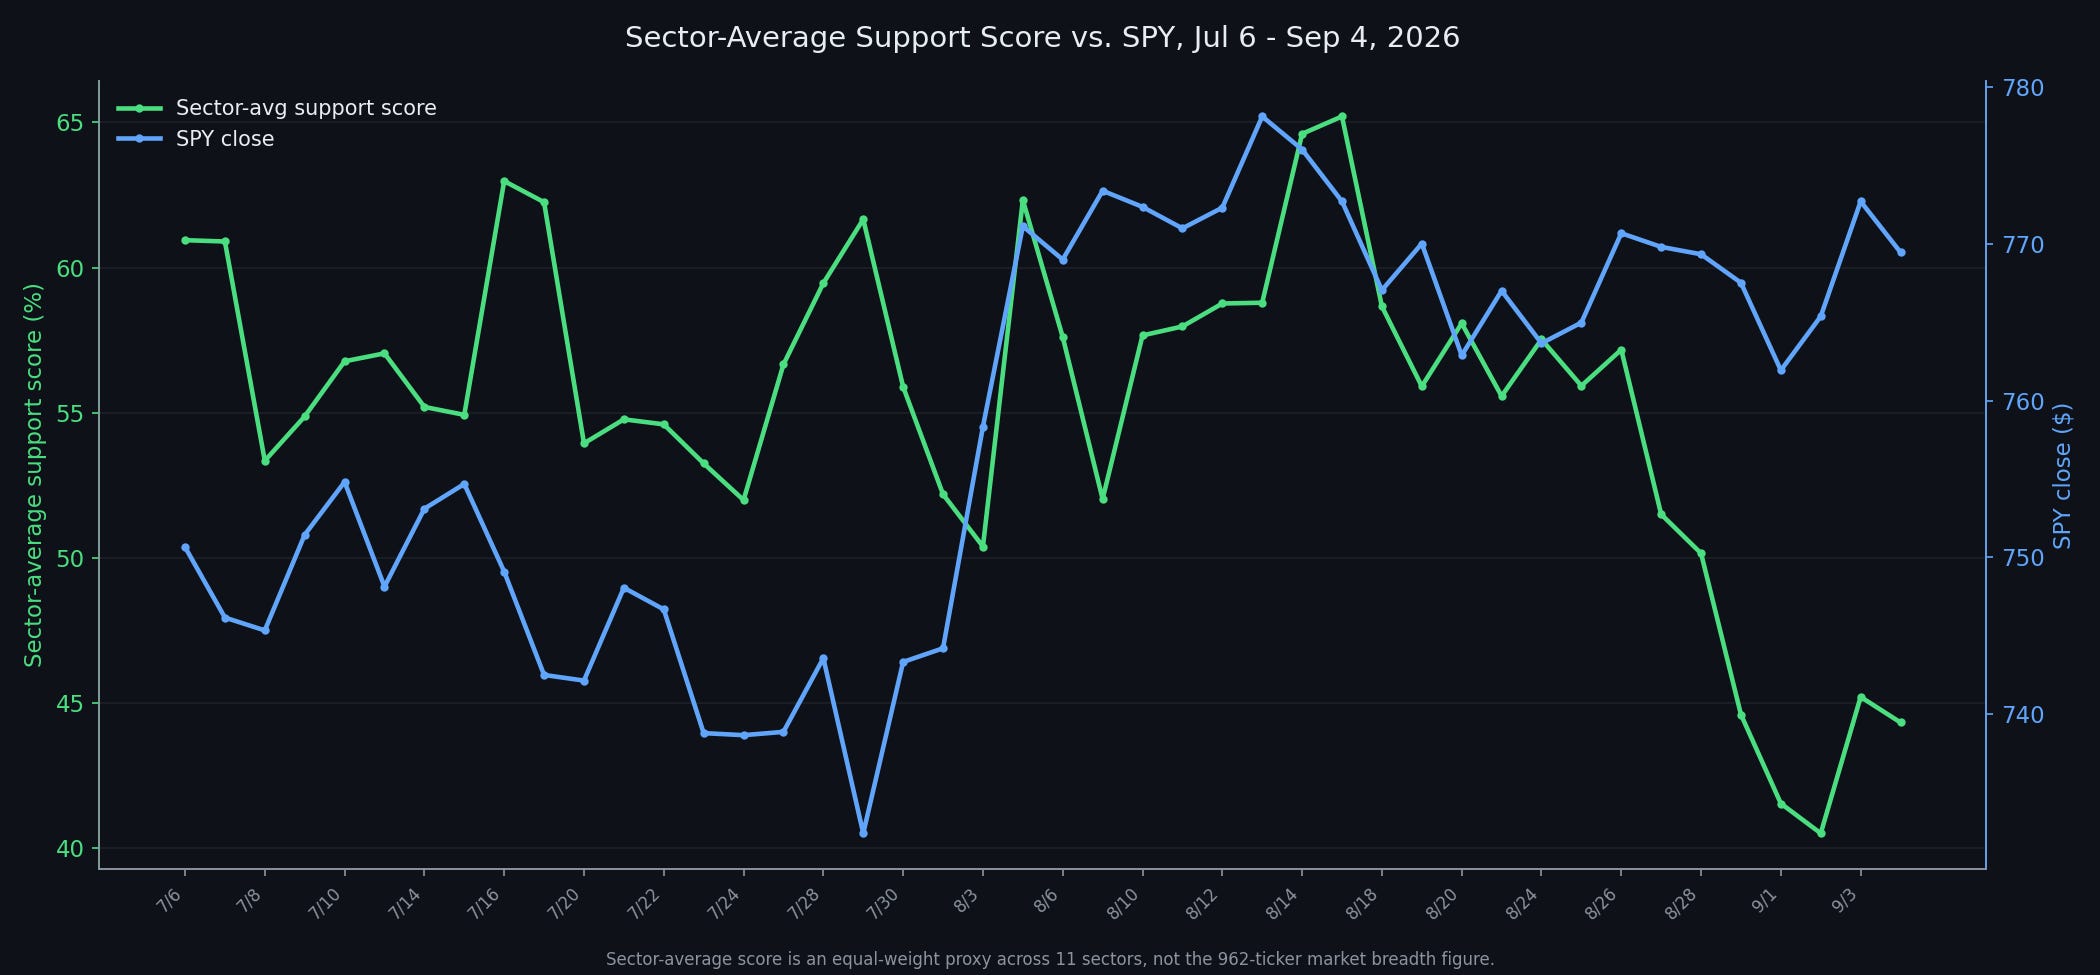
Since August 18, SPY has held up fine, drifting in the 760s to 770s and closing this week at 769, not far from its highs for the entire period. The sector-average support score, over that same stretch, fell from 65 to a low of 41 on September 1, only partly recovering to 44.3 by Friday. Price has stayed firm while breadth underneath it, by this measure, has fallen apart. That gap is the same one I have been circling for three weeks now, Real Estate’s median near zero, four straight weeks of lower Friday closes, Technology’s own rally never spreading past itself, but seeing it next to the index directly makes the point more plainly than any single sector’s story could. Whatever SPY has been telling you about the market this month, the support scores have been telling you something meaningfully more cautious underneath it. One last piece of color that’s important:
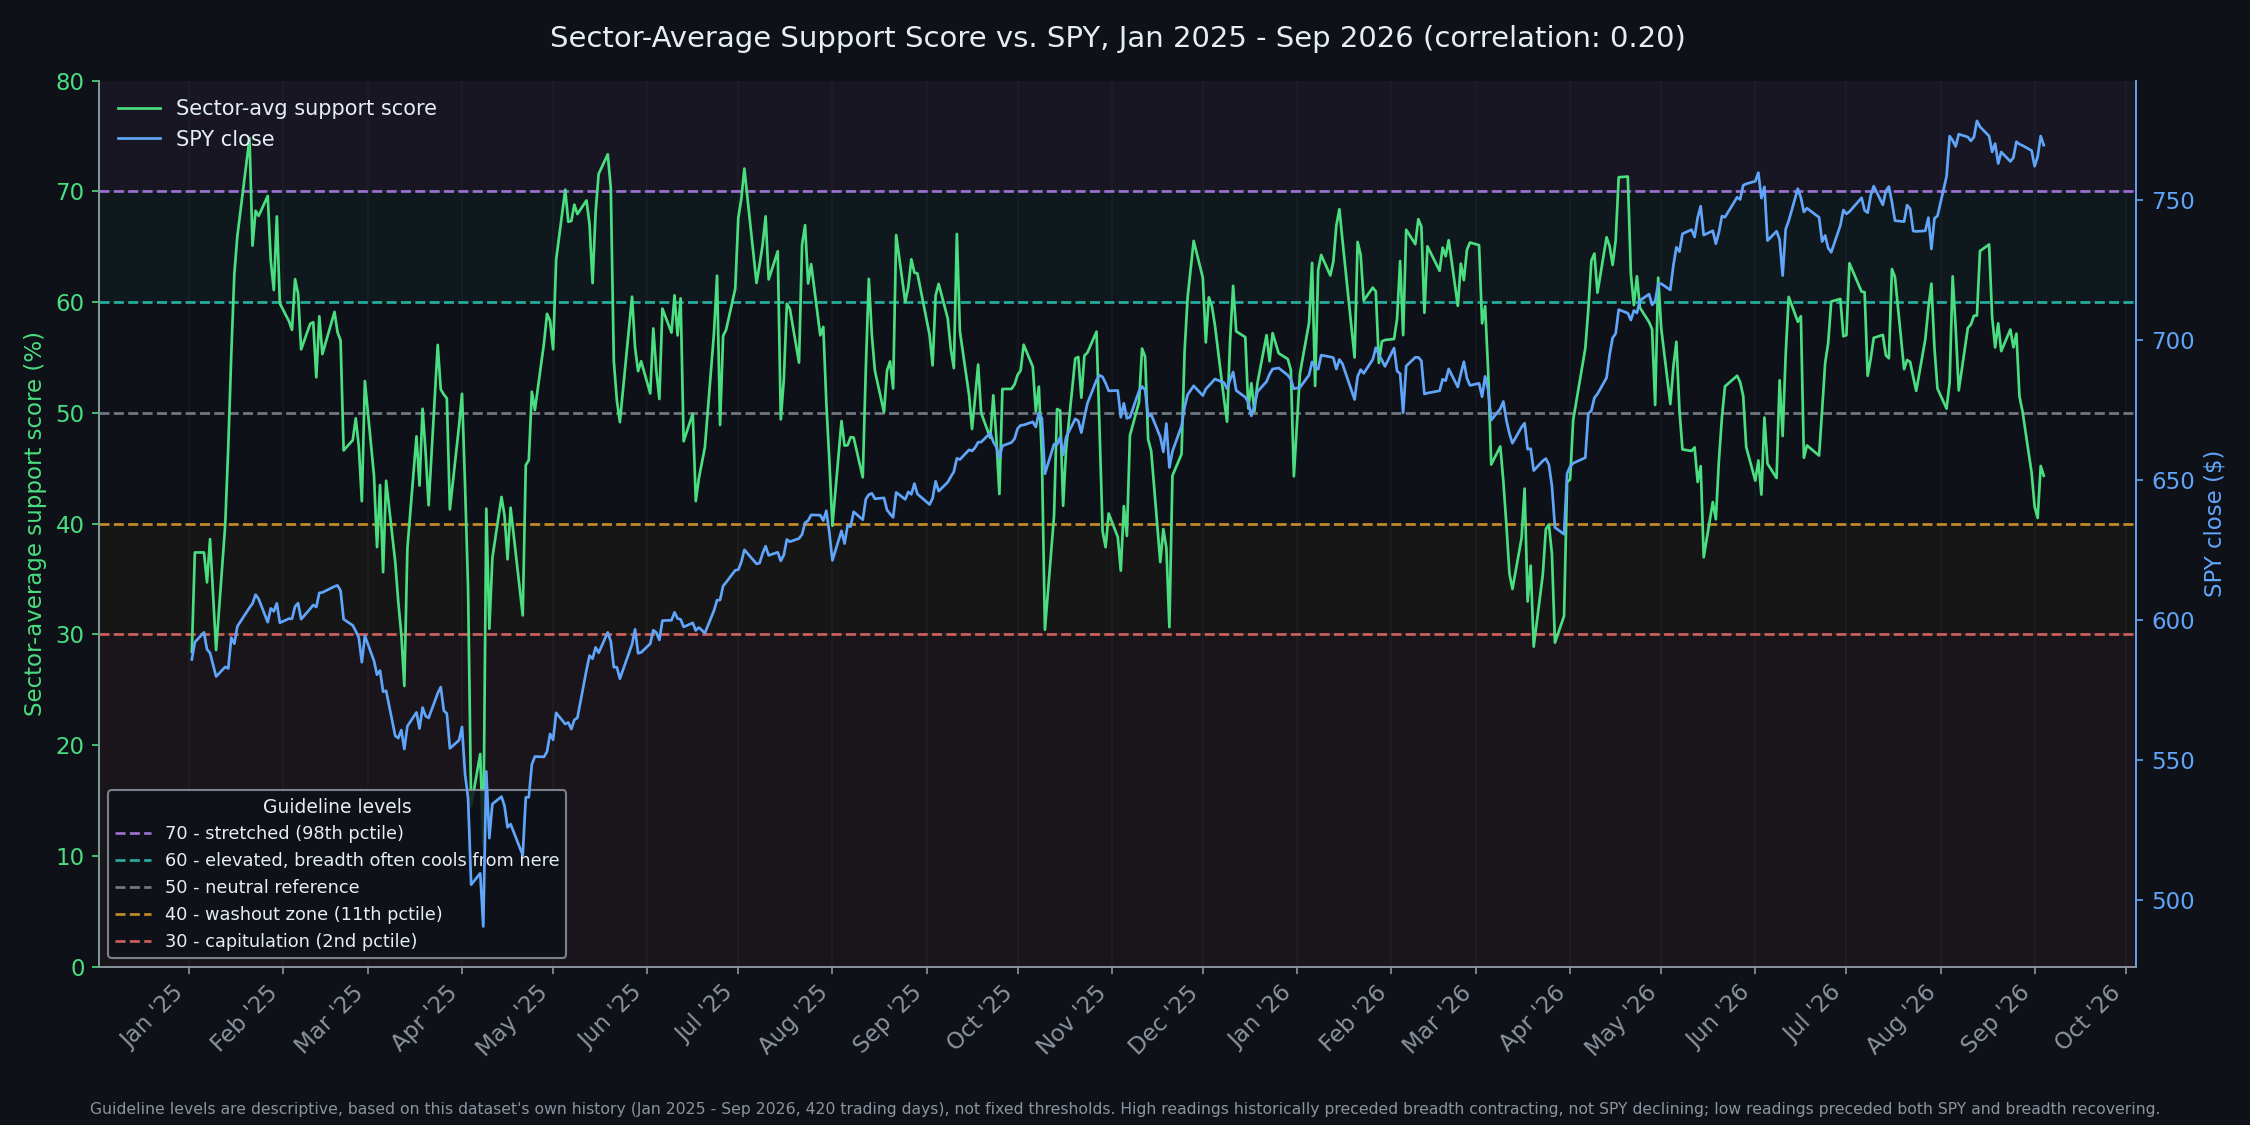
Day-to-day changes in the average sector support score track SPY’s daily moves with a correlation of about 0.76, so on any given day the two often move together. On its own, that’s not especially interesting.
What is interesting is what happens at the extremes. When the average support score stretches up to 60, or especially 70, the market can fairly be called crowded, and crowded markets tend to get culled. That doesn’t necessarily mean SPY itself turns lower. It does frequently get followed by a real contraction in breadth, support scores falling back even while the index holds up. That is exactly why it pays to look past the average and check the individual sector scores directly, it tells you where genuine participation still exists once the crowd starts to thin.
The more useful signal runs the other way. When the average support score rolls over to 40, or especially 30, it has historically marked capitulation, in virtually every case except the most severe market downdrafts. Take a look at the chart for a quick reminder where we are now…
(For a more complete treatment on the relationship between the Avg Sector Support Score and SPY, check out “Does the Support Score Actually Predict Anything?“)
Energy’s multi-week question finally got an answer
For three straight weeks I have been flagging a genuine disagreement between my support-score data and the Relative Rotation Graph on Energy, the level data showing real strength while the RRG kept the sector in Weakening territory. This week that disagreement resolved, and it resolved in Energy's favor. Energy is now sitting in Leading territory on the RRG, both relative strength and relative momentum above 100, a real change from where it sat every week since mid-August.
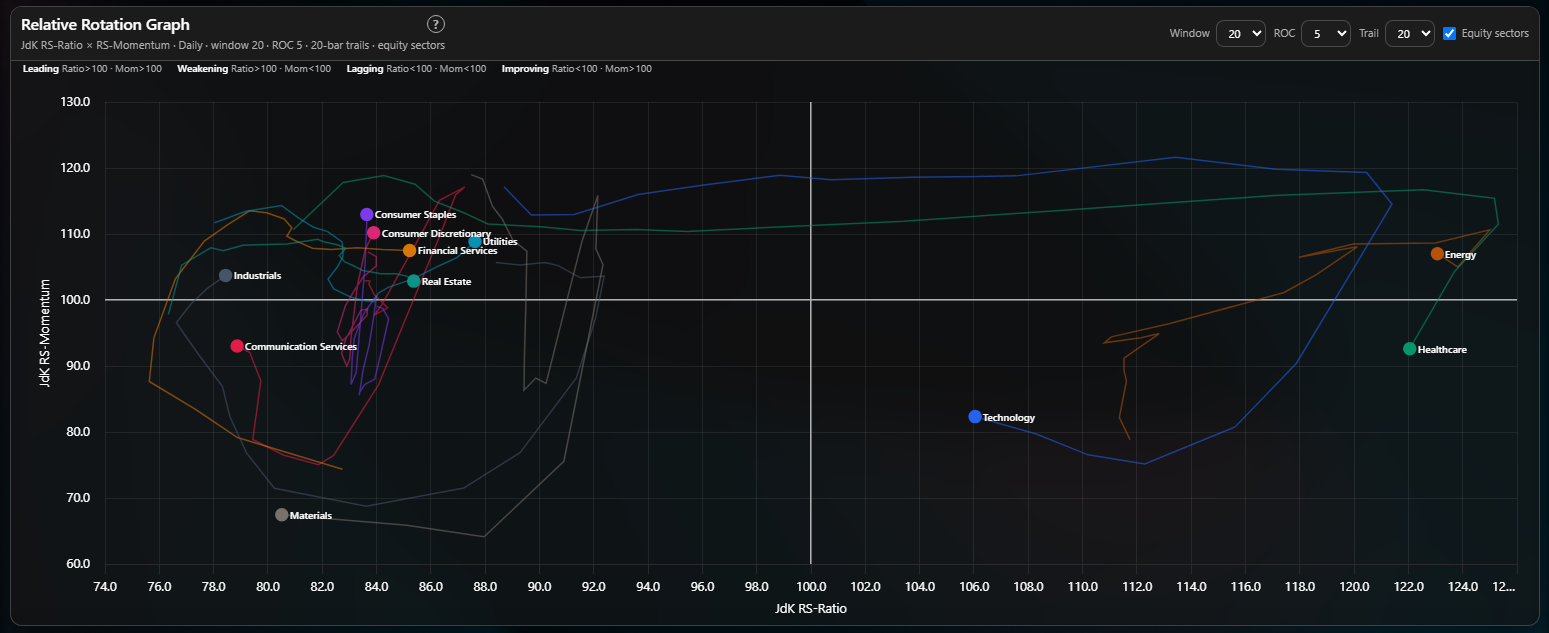
It resolved with a genuine catalyst behind it, too, not just a shift in positioning. Crude oil WTI up 9.69 percent on the week, Brent up 9.28 percent, the entire energy complex, gasoil, heating oil, gasoline, all up between 5 and 8 percent. Energy’s own support score actually pulled back slightly on the week, 82.1 to 78.3, but that is a pullback from a level, 91.2 on Wednesday, that ties its highest reading of the entire past two months. Worth saying plainly so it does not look like an unexplained gap: the score’s modest Monday-to-Friday dip and the RRG’s Leading placement are not in conflict, the RRG is measuring relative strength and momentum over a rolling window, not this week’s single delta, and Energy spent most of the week at or near its highest levels of the summer before easing off the peak into Friday. The tell I have been asking you to watch for weeks finally showed up, and when it did, price and positioning agreed, which is a high-confidence combination.
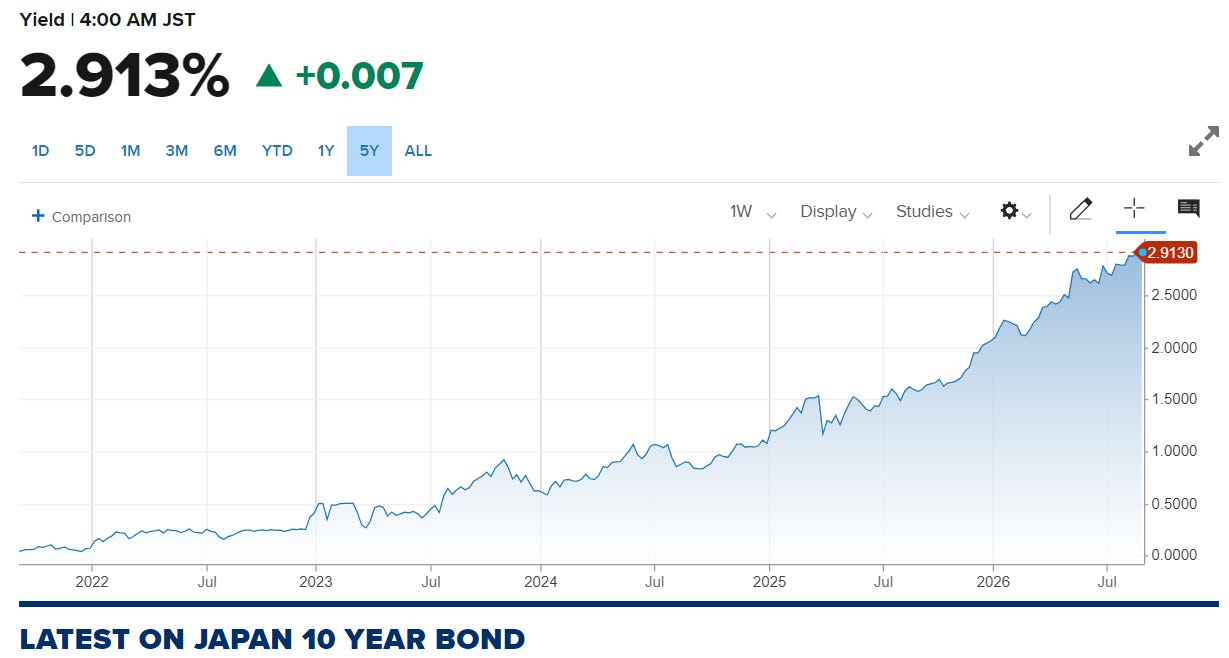
Higher energy prices put pressure on bond markets and Japan’s 10y JGB yield reportedly reached its highest level since 1996 the same week. The usual playbook here is straightforward: an oil shock raises inflation expectations, higher inflation expectations push long-term yields up globally, and higher yields are exactly the kind of pressure that typically weighs on Utilities specifically, a bond-proxy sector that wants lower rates, not higher ones. This week’s board did the opposite. Utilities was the second-best mover on the entire board, in a week when a strong jobs report was pushing in the same higher-for-longer direction as the oil-driven yield move, not against it, two separate forces both arguing for higher rates, with the sector most allergic to higher rates rallying anyway. Financial Services sitting alongside it as the week’s best mover is a different case, not the same puzzle, a steeper curve and a resilient economy genuinely help bank earnings regardless of which way long yields move, so its rally does not need the same explaining that Utilities does. I am again calling out Utilities as an anomaly for which there isn’t a clear explanation (that I can see).
And for anyone treating this as a broad flight-to-real-assets story: it was not. Gold fell 1.18 percent on the week. Silver fell 1.53 percent. Platinum fell 1.53 percent. If this were the debasement trade discussed in a recent article, precious metals would likely be moving with oil, not against it. This week’s energy rally looks like a specific, geopolitically driven commodity move, not a broader statement about currency debasement or stores of value generally.
What the detailed breakdown says about the rest of the board
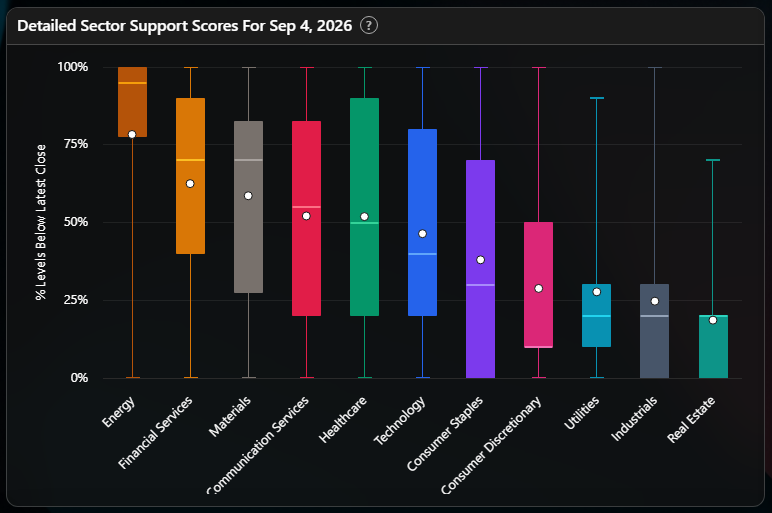
Beyond Real Estate, this week’s box plot has two other sectors worth a look. Healthcare’s box runs nearly the full range, top to bottom, with the mean sitting almost exactly on the median, a textbook “argument” sector this week where the label tells you nothing and the individual name tells you everything. Consumer Discretionary and Industrials both continue the pattern from recent weeks, means sitting well above already-low medians, meaning a handful of stronger names are propping up headline numbers that undersell just how weak the typical name in each sector actually is.
Energy and Materials both show the friendlier version, means sitting below their medians, a few weak names dragging an otherwise-solid typical name down. If you are inclined to write either sector off from a single soft data point, the box plot argues against it.
Consumer Staples’ own box fits the two-part story above better than a pure macro read would. It is wide, and the mean sits notably above the median, meaning a handful of names are still holding real strength while the sector’s typical name has broken. That lines up with a food complex that took a real hit in specific names, Campbell’s and its immediate read-across, rather than a uniform selloff across every staples ticker.
Zoom out and Financial Services, Utilities, and Consumer Staples all sat under the same hawkish tape this week and did three different things with it, banks liked the resilient economy, Utilities got whatever is behind its own hypothesis in the section below, and Staples took a real hit from margin anxiety, duration, and no recession bid to hide behind, all at once. Same macro backdrop, three different sector outcomes, worth remembering the next time a single week’s narrative feels like it should explain every sector’s move the same way.
(If any of this dot-versus-median language is new, the full walkthrough is here, worth a bookmark.)
What’s on deck
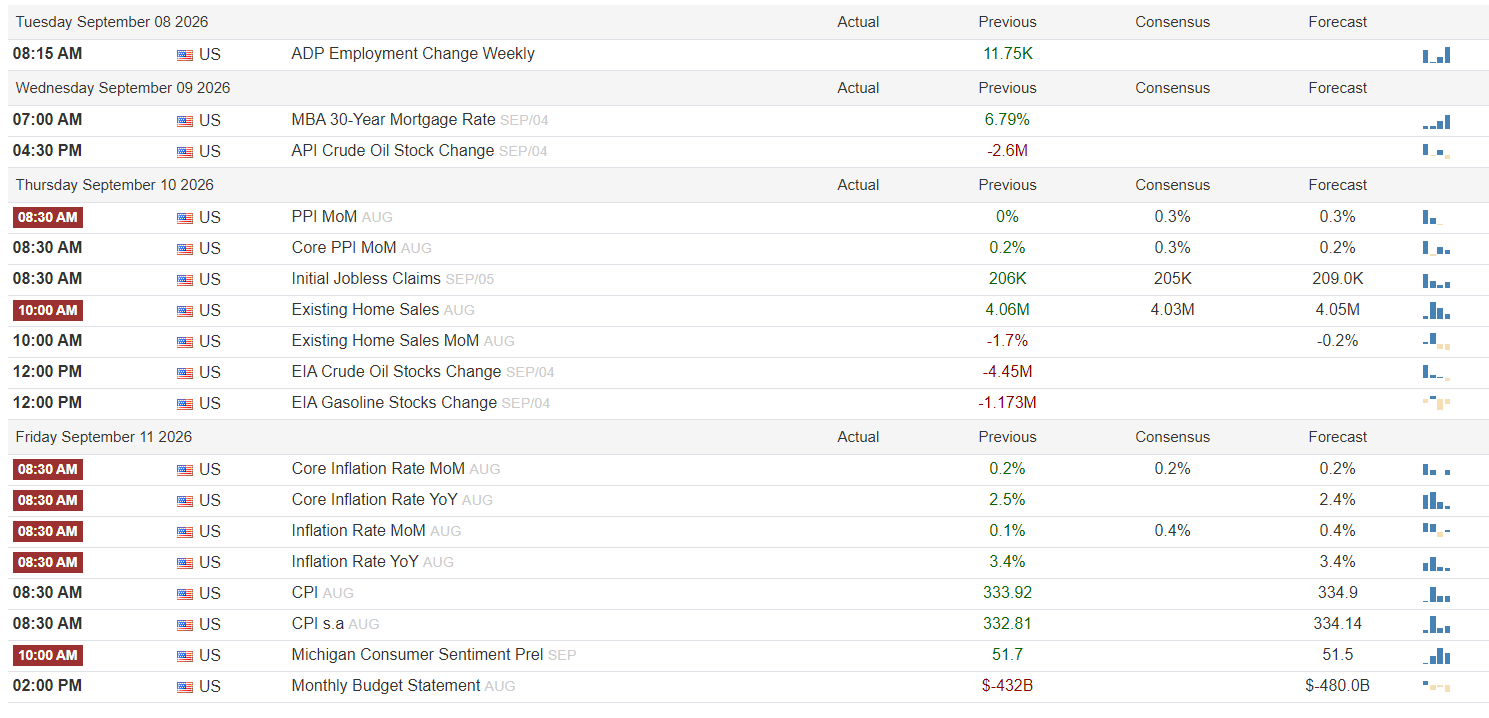
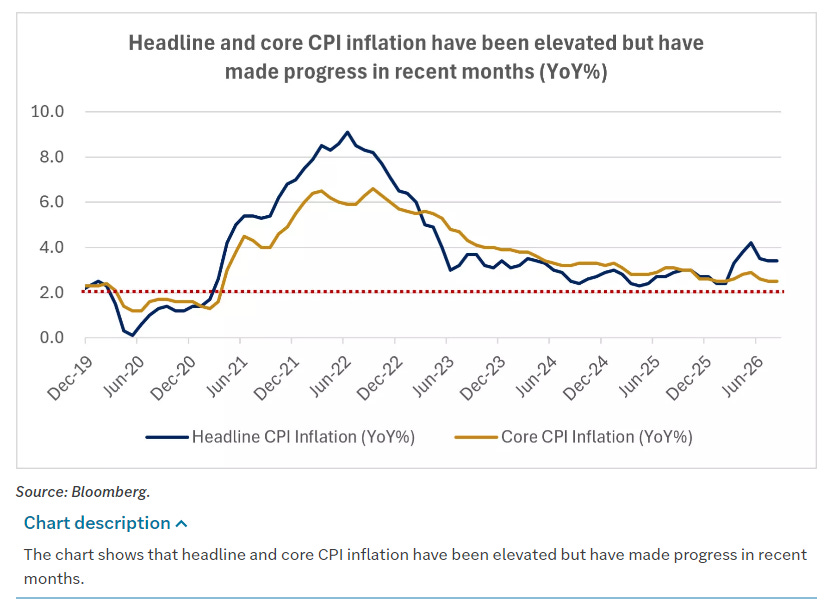
Briefly. The Fed's September meeting is the obvious focus, and three things the Fed Is likely watching: labor and wage growth, the next CPI print, and longer-term inflation expectations. Friday's strong print revived actual hike talk in a lot of coverage, not just reduced odds of a near-term cut, so I would not undersell which way the tape priced this by Friday close. The CPI release ahead of the meeting cuts both directions from here, a hot print would add to the hike case, a cool one is the data point most likely to pull the committee back toward patience. Next week is also a shortened one, Labor Day closes markets Monday, so real positioning for the week compresses into four sessions instead of five.
What this means, by your clock
If you trade in days to weeks: Real Estate’s breakdown is not subtle, and I would not bottom-fish it without strong theses to justify the risk. A median near 5 percent means the overwhelming majority of names in the sector are genuinely broken, not merely cheap. Financial Services has a reasonably clean fundamental case behind this week’s move, a strong economy is good for banks independent of rate timing, but Utilities does not, and I would treat that rally with more caution than the headline number alone suggests until a cleaner explanation shows up. Size accordingly.
If you invest in months to years: four straight weeks of lower Friday closes in the sector-average score is a trend at this point, not noise, and it is happening while SPY itself has held up fine, a genuine divergence between price and the positioning underneath it, not just sector rotation within a flat tape. That combination is happening alongside real macro whiplash, a hawkish Fed chair one week, a much stronger than expected jobs report the next, oil spiking on fresh geopolitical risk the week after that, two of those three arguing for higher-for-longer and one of them, Utilities’ rally, still not cleanly explained by any of it. Energy finally getting price and positioning to agree, after three weeks of disagreement, is the one genuinely resolved question on this board right now. Nearly everything else remains as unsettled as it has been all summer, and the index is not the place you would have seen that. With the market’s average support score pulling into capitulation levels and SPY holding ground, it simply be time to start watching for new leadership to emerge. Vol is still cheap, until it’s not so if you’re expecting SPY to catch up to the support score instead of the other way around, the market is still offering a compelling entry.
Talk soon, Bruce
If you’re not a subscriber yet, I’d love to have you. And if you’ve got questions about VolumeLeaders itself, what the data means, how to read the dashboard, anything, just reach out. Happy to answer them directly.
This newsletter is for informational purposes only and is not investment advice. Nothing here is a recommendation to buy or sell any security.
Thank you for being part of this community and for investing your time in this week’s edition. The quality of this readership — thoughtful, disciplined, engaged — is what makes this work meaningful. I’m grateful to build alongside you. Here’s to a week of clarity, conviction, and well-executed opportunities.
— VolumeLeaders